Please Note: Balanced Assessment printed materials are available from this site, except for those indicated below. Please use the order form and follow the ordering directions carefully as they have changed. Current prices can be found on our order form.
Please also note that the Balanced Assessment
Primary &
Elementary Tasks have been published by Corwin
Press. The Balanced Assessment Transition & Middle School Tasks have been published by Teachers' College Press. These tasks may still be viewed
in .pdf
format on this website but they may not be copied or printed.
Mathematics Content and Process Scoring System:
A Multidimensional Approach to the Scoring
of Balanced Assessment Tasks
Principles and Premises
In order to approach the design of balanced assessment packages and the scoring of student work, one must first have a clear view of the nature of mathematics. One must also have a clear idea of the kinds of understandings and skills that we wish to assess in our students. In this section we will describe our views on the structure of the subject of mathematics. In the following sections we will show how this view of the structure of the subject shapes the way we formulate tasks, how we assemble them into balanced assessment packages, and how we score student work on these tasks. We will provide concrete examples of this process, and also document the use of the MCAPS scoring tool.
The Way We See the Structure of the Subject
Like many subjects, it is possible to identify both content and process dimensions in the subject of mathematics. Unlike many subjects, where most of the process dimension refers to general reasoning, problem-formulating and problem-solving skills, the process dimension in mathematics refers to many skills that are mathematics specific. As a result, many people tend to lump content and process together when speaking about mathematics, calling it all mathematics content.
We believe it is important to maintain the distinction between content and process. In part we say this because we believe that this distinction reflects something very deep about the way humans approach mental activity of all sorts. All human languages have grammatical structures that distinguish between noun phrases and verb phrases. They use these structures to express the distinction between objects, and the actions carried out by or on these objects.
We believe that the content-process distinction in mathematics is best described by the words object and action. What are the mathematical objects we wish to deal with? What are the mathematical actions that we carry out with these objects? We will try to answer these questions in a way that makes clear the continuity of the subject from the earliest grades through post-secondary mathematics. Seen in the proper light, there are really very few kinds of mathematical objects and actions.
The Objects of Mathematics
The first set of mathematical objects we need to consider is number and quantity. Indeed, elementary mathematics is largely about these objects, and the actions we carry out with and on them.
number/quantity
· integers [positive and negative whole numbers and zero]
· rationals [fractions, decimals and all the integers]
· measures [length, area, volume, time, weight]
·
reals [![]() , e, etc. and all
the rationals]
, e, etc. and all
the rationals]
· complex numbers
· vectors and matrices
Along with number and quantity we introduce very early a concern for another kind of mathematical object, namely shape and space.
shape/space
· topological spaces [concepts of connected and enclosure]
· metric spaces [with such shapes as lines/segments, polygons, circles, conic sections, etc.]
From the beginning we try to make students aware of pattern in the worlds of number and shape. Pattern as a mathematical object matures into function, which is the central mathematical object of the subjects we call algebra and calculus.
function/pattern
· functions on real numbers [linear, quadratic, power, rational, periodic, transcendental]
· functions on shapes
There are several other kinds of mathematical objects that have less prominent roles in the mathematics we expect our youngsters to study. Most important among these are
chance/data
· relative frequency and probability
· discrete and continuous data (Some aspects of data collection, organization and presentation can be done in the earliest grades but little, if any, data analysis; notions of probability are not realistically addressable until late middle school. )
and
arrangement
permutations, combinations, graphs, networks, trees, counting schemes (which at the youngest grades tends to blend with the study of patterns of numbers and shapes.)
The Actions of Mathematics
The process dimension of mathematics has many actions that are mathematics-specific. It also involves actions that are properly regarded as general problem-formulating, problem-solving, and reasoning skills. We divide these skills into four categories:
· modeling/formulating
· transforming/manipulating
· inferring/drawing conclusions
· communicating
With the exception of communication, each of these actions has aspects that are specific to mathematics, and aspects that are not specific to mathematics, but that are quite general in nature. Here is a list of some of these aspects:
modeling/formulating
domain-general
-observation and evidence gathering
-necessary and/but not sufficient conditions
-analogy and contrast
domain-specific
-deciding, with awareness, what is important,
and what can be ignored
-formally expressing dependencies, relationships and constraints
transforming/manipulating
domain-general
-understanding the rules of the game
-understanding the nature of equivalence and identity
domain-specific
-arithmetic computation
-symbolic manipulation in algebra and calculus
-formal proofs in geometry
inferring/drawing conclusions
domain-general
-shifting point of view
-testing conjectures
domain-specific
-exploitation of limiting cases
-exploitation of symmetry and invariance
-exploitation of between-ness
communicating
making a clear argument orally and in writing (using both prose and images)
It is evident that there is no reasonable way to separate, nor should there be any interest in separating, the domain-specific and the domain-general aspects of the process dimension of mathematics.
Procedures
We now describe how these principles are applied in practical procedures of scoring. This description will 'come to life' when you apply it to specific tasks, rubrics, and examples of
student work .
As previously mentioned, in order to approach the problem of designing balanced assessment packages in mathematics one must have a clear view of the kinds of understandings and skills that we wish to assess in our students, and the ways in which the tasks we design elicit demonstrable evidence of those skills and understandings.
Each task is classified according to content domain, i.e. the mathematical objects that are prominent in the accomplishment of the task. Most of our tasks deal predominantly with a single sort of mathematical object, although some deal with two.
We also consider to what extent the following four kinds of mathematical actions are demanded by the task:
Modeling/Formulating: How well does the student take the presenting statement and formulate the mathematical problem to be solved? Some tasks make minimal demands along these lines. For example, a problem that asks students to calculate the length of the hypotenuse of a right triangle given the lengths of the two legs does not make serious demands. On the other hand, the problem of how many three-inch diameter tennis balls can fit in a (rectangular parallelepiped) box that is 3" ´ 4" ´ 10", while exercising the same Pythagorean muscles in the solution, is rather different in the demands that it makes on students ability to formulate problems.
Transforming/Manipulating: How well does the student manipulate the mathematical formalism in which the problem is expressed? This may mean dividing one fraction by another, making a geometric construction, solving an equation or inequality, plotting graphs, or finding the derivative of a function. Most tasks will make some demands along these lines. Indeed, most traditional mathematics assessment consists of problems whose demands are primarily of this sort.
Inferring/Drawing Conclusions: How well does the student apply the results of his or her manipulation of the formalism to the problem situation that spawned the problem? Traditional assessments often pose problems that make little demand of this sort. For example, students may well be asked to demonstrate that they can multiply the polynomials (x+1) and (x1), but not be expected to notice (or understand) that the numbers one cell away from the main diagonal of a multiplication table always differ from perfect squares by exactly 1.
Communicating: How well do students communicate to others what they have done in formulating the problem, manipulating the formalism, and drawing conclusions about the implications of their results?
Since we do not expect each task to make the same kinds of demands on students in each of the four skills/understandings area, we assign a single digit measure of the prominence of that skill/understanding in the problem according to the following scale of weighting codes:
Weighting codes
0 not present at all
1 present in small measure
2 present in moderate measure, and affects solution
3 a prominent presence
4 a dominant presence
Note that these numbers are not measures of student performance, but measures of the demands of the task for a given performance action.
Most tasks will involve these skills and understandings in some combination; different tasks will call differently on these actions. Therefore, in designing tasks it is necessary to pay particular attention to the nature of the demands on performance that the tasks make, and to balance these demands across any collection of materials.
For each task, a decision is made as to how the tasks demands are distributed among the content domains
Content domain weighting (Entries must sum to 1)
|
Number and Quantity |
|
|
Shape and Space |
|
|
Pattern and Function |
|
|
Chance and Data |
|
|
Arrangement |
|
and among the various sorts of performance actions:
Process weighting (Each entry is on a 0-4 scale)
|
Modeling/ |
Transforming/ |
Inferring/Drawing Conclusions |
Communicating |
|
|
|
|
|
Writing Rubrics for Tasks
After a task has weights assigned that reflect the different demands the task makes on a student, it is possible to write scoring rubrics. The rubric is specific to the task, and analyzes performance in the areas we have described.
No one can write rubrics that exhaustively anticipate the richness and variety of student responses. Teachers who use the rubrics we write are urged to use them as a guide where they are helpful, and to use their own good judgment when they find our rubrics not shedding light on their own students efforts.
Once a task is classified according to the mathematical objects that are prominent in the accomplishment of the task and the mathematical actions that are called forth, we can approach the scoring of student work with the following guidelines held firmly in mind:
· Balanced Assessment packages are designed to allow their users to make informed judgments about both the success of individual students, and the success of instructional programs as a whole.
· All BA tasks are inherently multidimensional, and thus notions of uni-dimensional ranking of students are inappropriate.
· Scoring along any single dimensional is at best ordinal, and notions of ratio or even interval scales are inappropriate.
For each task we expect the person scoring the students performance to use one of the following performance icons for each of the four different kinds of skill and understanding, or mathematical actions. These performance icons may be thought of as ordinal measures with the following descriptors:
![]() the student shows little evidence of skill or
understanding
the student shows little evidence of skill or
understanding
[internal code 0]
![]() the
student shows a fragile skill or understanding
the
student shows a fragile skill or understanding
[internal code 1]
![]() the student shows an adequate level of skill or
understanding
the student shows an adequate level of skill or
understanding
[internal code 2]
![]() the student shows a deep and robust level of skill or
understanding
the student shows a deep and robust level of skill or
understanding
[internal code 3]
The score sheet for a group of students for a given task might look like this:
|
Task name |
Content domain(s) |
Process Weights |
|||
|
|
|
Modeling/ Formulating |
Transforming/ Manipulating |
Inferring/ Drawing Concl. |
Communicating
|
|
|
|
|
|
|
|
|
Student scores |
M/F |
T/M |
I/DC |
C |
|
Student 1 |
|
|
|
|
|
Student 2 |
|
|
|
|
|
Student 3 |
|
|
|
|
|
Student 4 |
|
|
|
|
|
Student 5 |
|
|
|
|
The assessor calculates a weighted score for each of the four mathematics actions, and inserts into each of the pertinent cells one of the four performance icons (or their internal codes) described above, based on the students performance as delineated in the rubric. This process is described in detail in the scoring example on page 8.
No inference of competence of a student with respect to any mathematical action or mathematical content domain should ever be based on performance on a single task.
Assessing the overall performance of individual students in mathematics requires us to record their performance on individual tasks, and to aggregate their performance across a large number of individual tasks while preserving, to as large an extent as possible, the richness of the information yielded by the observations on individual tasks.
One could imagine reporting the complete student record of performance on each task. This volume of information is likely to overwhelm whoever looks at it, and, except in the case of the clinician specifically interested in a particular student, to be of little use to anyone. For example, a complete student record might have this structure:
|
Student performance by task |
||||
|
|
Modeling/ Formulating |
Transforming/ Manipulating |
Inferring/ Drawing Conclusions |
Communicating |
|
Task 1 |
|
|
|
|
|
Task 2 |
|
|
|
|
|
Task 3 |
|
|
|
|
|
Task 4 |
|
|
|
|
|
Task 5 |
|
|
|
|
Each cell in this table contains the weighting code of that task on the skill/understanding in question for a given kind of mathematical object. Each cell corresponding to a task the student has tried also contains a performance icon (or its internal code) denoting the quality of his or her performance on that aspect of the task.
Such a body of information might well be useful to teachers for informing instructional decisions and, in addition, can be thought of as a cumulative record of a students mathematics activities throughout the school years. However, it may be somewhat inundating for purposes of accountability.
Scoring Example
Here is a comparison of the work of two students on a collection of tasks. The students were asked to choose five tasks. Their choices were to be governed by the following constraints:
· they could choose no more than two tasks from any single content domain
· they could choose no more than three skills tasks[short tasks, primarily involved with transformation/manipulation.]
· they must choose at least two problems [longer tasks, considerable formulation and inference demand]
Here are the results of the students efforts:
|
Task |
Content Domain |
M/F Wgt. |
Score |
T/M Wgt. |
Score |
I/D Wgt. |
Score |
C Wgt. |
Score |
||||
|
STUDENT 1 |
|
|
|
|
|
|
|
|
|
|
|||
|
L to Scale |
ss |
0 |
0 |
2 |
3 |
1 |
2 |
1 |
1 |
|
|||
|
Egyptian Statue |
ss |
1 |
2 |
3 |
2 |
2 |
2 |
2 |
2 |
|
|||
|
Bathtub Graph |
f |
4 |
3 |
2 |
2 |
0 |
0 |
3 |
3 |
|
|||
|
Gligs & Crocs |
f |
3 |
2 |
2 |
3 |
2 |
3 |
2 |
2 |
|
|||
|
Fermi I |
n |
4 |
3 |
1 |
0 |
3 |
3 |
2 |
2 |
|
|||
|
|
|
|
|
|
|
|
|
|
|
|
|||
|
|
|
|
10 |
|
10 |
|
10 |
|
10 |
|
|||
|
STUDENT 2 |
|
|
|
|
|
|
|
|
|
|
|||
|
Egyptian Statue |
ss |
1 |
2 |
3 |
2 |
2 |
2 |
2 |
2 |
|
|||
|
Dont Fence Me In |
ss |
4 |
2 |
1 |
2 |
3 |
2 |
2 |
2 |
|
|||
|
Books from Andonov |
f |
2 |
2 |
2 |
2 |
2 |
2 |
2 |
2 |
|
|||
|
Melons & Melon Juice |
f |
3 |
2 |
2 |
2 |
2 |
2 |
2 |
2 |
|
|||
|
Survey says... |
cd |
2 |
2 |
2 |
2 |
2 |
2 |
3 |
2 |
|
|||
|
|
|
|
|
|
|
|
|
|
|
|
|||
|
|
|
|
10 |
|
10 |
|
10 |
|
10 |
|
|||
The leftmost column indicates the name of the task. The next column indicates the predominant mathematical content domain (n = Number and Quantity, ss= Shape and Space, f = Pattern and Function, cd = Chance and Data, a= Arrangement). The bold figures are the weights assigned to each of the mathematical action categories for each of the problems. The figures in italics are the scores (0, 1 or 2 for partial level, 3 for full level) that each student received on that section of each of the problems.
Note that a column sum of the scores at this stage would record the fact that the students were equally competent at modeling, transforming, inferring and communicating, although a teacher might intuitively feel that there were distinctions to be made on the performance of these two students.
To calculate the weighted sum of the first students performance on modeling in the domain of Function we note that the first function problem was assigned an M/F weight of 4 and that the student was given a score of 3 (i.e. full level) on it. The second problem in the domain of function was assigned an M/F weight of 3 and the student made partial level on it, receiving a score of 2. Thus, the student received 18 M/F marks (3´4 + 2´3) out of a possible 21 (3´4 + 3´3) in the domain of function, resulting in a decimal score of 0.86.
Similar calculations are done for each cell. Performance icons are then assigned as follows:

Now here are the records of these two students aggregated over domains:
Student record aggregated over tasks within content domains
|
Student 1 |
|
|
|
|
|
action domain
|
Transforming/ |
Inferring/Drawing Conclusions |
Communicating |
|
|
Number and Quantity |
|
|
|
|
|
Shape and Space |
|
|
|
|
|
Pattern and Function |
|
|
|
|
|
Chance and Data |
|
|
|
|
|
Arrangement |
|
|
|
|
Student record aggregated over tasks within content domains
|
Student 2 |
|
|
|
|
|
action domain
|
Modeling/ |
Transforming/ |
Inferring/Drawing Conclusions |
Communicating |
|
Number and Quantity |
|
|
|
|
|
Shape and Space |
|
|
|
|
|
Pattern and Function |
|
|
|
|
|
Chance and Data |
|
|
|
|
|
Arrangement |
|
|
|
|
Note that this presentation clearly reflects the inherent difference in the performance of the two students, which the numerical presentation did not reveal.
It should be stressed that at this level of aggregation there are no longer any numerical measures entered in the cells of the aggregate student record, only the aggregated performance icon appropriate to that cell.
The full power of this method of recording and reporting student performance becomes clear when one has enough data to fill all the cells. Here are the student records of four fourth-grade students aggregated over eleven tasks. These tasks were distributed over the content domains as follows: four Number and Quantity tasks, one Shape and Space task, three Pattern and Function tasks, one Chance and Data and two Arrangement tasks.
Student record aggregated over tasks within content domains
|
Student A |
|
|
|
|
|
action domain |
Modeling/ |
Transforming/ |
Inferring/ Drawing |
Communicating |
|
Number and Quantity |
|
|
|
|
|
Shape and Space |
|
|
|
|
|
Pattern and Function |
|
|
|
|
|
Chance and Data |
|
|
|
|
|
Arrangement |
|
|
|
|
|
|
|
|
|
|
Student record aggregated over tasks within content domains
|
Student B |
|
|
|
|
|
action domain |
Modeling/ |
Transforming/ |
Inferring/ Drawing |
Communicating |
|
Number and Quantity |
|
|
|
|
|
Shape and Space |
|
|
|
|
|
Pattern and Function |
|
|
|
|
|
Chance and Data |
|
|
|
|
|
Arrangement |
|
|
|
|
|
|
|
|
|
|
Student record aggregated over tasks within content domains
|
Student C |
|
|
|
|
|
action domain |
Modeling/ |
Transforming/ |
Inferring/ Drawing |
Communicating |
|
Number and Quantity |
|
|
|
|
|
Shape and Space |
|
|
|
|
|
Pattern and Function |
|
|
|
|
|
Chance and Data |
|
|
|
|
|
Arrangement |
|
|
|
|
|
|
|
|
|
|
Student record aggregated over tasks within content domains
|
Student D |
|
|
|
|
|
action domain |
Modeling/ |
Transforming/ |
Inferring/ Drawing |
Communicating |
|
Number and Quantity |
|
|
|
|
|
Shape and Space |
|
|
|
|
|
Pattern and Function |
|
|
|
|
|
Chance and Data |
|
|
|
|
|
Arrangement |
|
|
|
|
|
|
|
|
|
|
The reason for the use of the performance icons now becomes clear. It is possible for a teacher or parent to grasp quickly and perceptually how well a child is doing, and where his or her strengths and weaknesses lie. The pattern of light and dark distributed through a table is well known to be readily intelligible as a conveyer of a large body of data. Its most widespread use is to be found in Consumer Reports and other such publications.
Finally, it is often informative to aggregate these data across mathematical actions. In the case of our four students one obtains
Student record aggregated over tasks
|
Modeling/ |
Transforming/ |
Inferring/ Drawing |
Communicating |
|
|
|
|
|
Student record aggregated over tasks
|
Modeling/ |
Transforming/ |
Inferring/ Drawing |
Communicating |
|
|
|
|
|
Student record aggregated over tasks
|
Modeling/ |
Transforming/ |
Inferring/ Drawing |
Communicating |
|
|
|
|
|
Student record aggregated over tasks
|
Modeling/ |
Transforming/ |
Inferring/ Drawing |
Communicating |
|
|
|
|
|
Note that all of the students communicate reasonably well. Except for Student D, they are all weak in making inferences and drawing conclusions. Except for Student A, they are all reasonably able to do the kinds of manipulations that are traditionally expected of them in mathematics classes. Except for Student D, they do not model and mathematize very well.
From these aggregated data one might conclude that the mathematical strengths and weaknesses of Students B and C are similar, but looking at the unaggregated data for these students one might well come to the conclusion that they have different instructional needs.
We believe that further aggregation of student performance data does not make any sense. While it is possible to collapse these data further, we wish to stress as forcefully as we can that any such aggregation will substantially reduce the utility of these materials to contribute to informed decisions about students.
Assessing Project Work
The Balanced Assessment team thinks of projects as intellectual undertakings that require students to make an effort over an extended period of time to structure and formulate a problem and then to analyze the problem as they have formulated it. Projects are not problems with unique, correct solutions. Projects are not long and complicated versions of problems that one normally assigns in the context of a classroom assignment. Projects are not problems that require tricky insights or inventions to solve. The essence of a Balanced Assessment project is that it is a task that requires a student to ruminate and reflect about a rich web of complexity, and to sort out some main threads that can serve as the basis for structuring a response.
In the course of addressing the problem that forms the core of the project as they have formulated it, students will have to perform a wide range of traditionally taught mathematical actions that might include manipulating algebraic symbols, plotting graphs, producing geometric constructions, and compiling tables, as well as performing numerical computations. The accurate performance of these actions, as important as they are, is only a part of doing a Balanced Assessment project. Students are also required to make inferences, draw conclusions, and present their work in both written and oral form.
In this section we shall try to lay out what we think are some of considerations that teachers should keep in mind as their students work on projects and as they, the teachers, assess the products of their students' efforts.
How shall I organize the class for project work?
Mathematics has traditionally been a subject in which we have insisted that students work alone. Whatever the merits of that viewpoint might be with respect to covering the content of the syllabus, it seems to us that project work is different. The essential issue in project work is development of desirable habits of mind about organizing and analyzing complexity. Adults, when confronted with tasks of this sort, often address them in groups. The reason for doing so is the intellectual resonance and symbiosis that leads groups of people to fashion far better solutions to complex problems when they work cooperatively than when they work in isolation. We suggest, therefore, that students undertake project work in small groups. You may want to give some thought to how the groups ought to be composed, and whether or not to juggle the composition of the small groups at various times during the school year.
How much time shall I allocate to project work during the year?
This will vary with individual teachers. Some teachers will try to build a whole years work around projects. We find that it is often difficult to do this -- there is always the nagging feeling that the curriculum is not being covered. On the other hand, we feel that the kind of intellectual development that coping with a project offers is of sufficient importance that students ought to spend no less than 10% of their time, and probably as much as 25% of their time on such work.
One could imagine students spending one quarter of their time every week throughout the school year on their continuing project work. Alternatively, one can imagine intensive two week project periods distributed throughout the year. During these periods students would use all of their mathematics time for project work. Other time arrangements are also possible. Ultimately, it will be individual teachers who make this decision in light of their understanding of what best fits the needs of their classes.
How should project work be presented?
We think that project work should be presented both in writing and orally. The written presentation should describe the contextual setting and how, within that setting, the problem is defined. The written presentation should present explicit arguments for why the project omits consideration of some factors and includes others. It should show clearly how solution was approached. It should indicate clearly where there are further issues to investigate.
The oral presentation should be made publicly to the entire class after the teacher and at least some of the students have read the written presentation. Following a brief outlining of the written document, the presenting students should entertain questions and comments.
Here is one possible specific way you might organize the presenting of project work. Have each group submit a written report of its work. In addition, ask each group to read the written reports of two other groups. On the day of the oral presentations, have each group present its work and then serve as a panel to answer questions put to them by the other groups that have read their work, as well as by the teacher and other students.
How do I grade project work?
All Balanced Assessment projects ask the student to prepare a document with an intended purpose for an intended audience. Consequently, scoring of projects comes down to an analysis of two questions:
Is the document suitable for the specified audience?
Does the document fulfill the requested purpose?
To aid in evaluating student project work in the light of these two criteria, we suggest the following six perspectives; each perspective may allow you to reach conclusions about some aspect of the student's effort.
Organizing the Subject: How well does the student structure a large collection of inter-related issues and identify possible problematic areas? Are the constraints described in the problem made clear at the outset? How well does the student argue the relative importance of factors that are taken into consideration in addressing the problem and the relative unimportance of factors that are ignored? Does the report proceed in a logical manner?
Analyzing the Problem: How well does the student define the problem that he or she is setting out to work on? Is the student clear about all the resources, both tools and information, that will be needed to address the problem? Does the student draw appropriate implications about the given data?
Accuracy and Appropriateness of Computation/Manipulation: Are the symbolic manipulations carried out accurately? Are the graphs plotted correctly? Are the axes labeled sensibly? Is the scale reasonable? Are the geometric constructions constructable? Are the table columns properly labeled? Are the computations that underlie computed columns clearly defined? Are the numerical computations done accurately? Are the graphs, charts, tables used appropriately? Are they pertinent to and do they strengthen the argument?
Thoroughness of Inquiry : Is the work perfunctory or thorough? Is the reader left to fill in too many missing steps? Are all the implications of the complexity of the problem followed up and examined? Is the reports level of detail adequate?
Clarity of Communication : Can the student's work be read by a colleague who is previously unacquainted with the work? Is the student's written presentation intelligible to another teacher? to the principal? to a group of parents?
Drawing Conclusions : Do students draw reasonable conclusions from the work that they have done? Do they explore clearly the ways in which their work answers the problems that they have set for themselves?
Extending the Inquiry : Has the student identified interesting aspects of the problem that lend themselves to further exploration? Has the student identified related problems that might be approached in similar ways?
Finally, it should be said that we are mindful of the fact that the constraints and opportunities that teachers have vary from place to place. Not everything we suggest will be desirable, or even possible, at every location. However, we are certain that challenging the students with a significant amount of project work will be rewarding and engaging to both teacher and student.
Sample Scoring Packet
for a
Specific Task
(includes Student Work)
The Task:
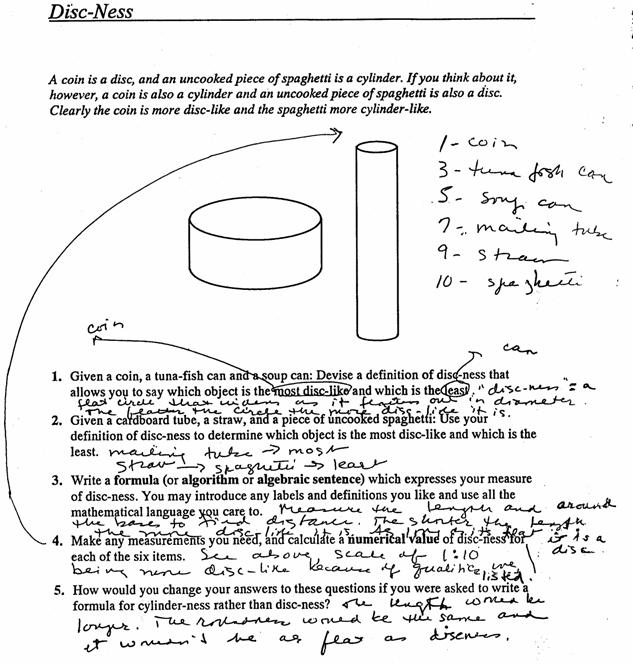
Disc-Ness
A coin is a disc, and an uncooked piece of spaghetti is a cylinder. If you think about it, however, a coin is also a cylinder and an uncooked piece of spaghetti is also a disc. Clearly the coin is more disc-like and the spaghetti more cylinder-like.

1. Given a coin, a tuna-fish can and a soup can: Devise a definition of disc-ness that allows you to say which object has the most disc-ness and which has the least.
2. Given a mailing tube, a straw, and a piece of uncooked spaghetti: Use your definition of disc-ness to determine which object has the most disc-ness and which has the least.
3. Write a formula (or algorithm or algebraic sentence) which expresses your measure of disc-ness. You may introduce any labels and definitions you like and use all the mathematical language you care to.
4. Make any measurements you need, and calculate a numerical value of disc-ness for each of the six items.
5. How would you change your answers to these questions if you were asked to write a formula for cylinder-ness rather than disc-ness?
The Solution:
Disc-ness L003
Math Domain
|
|
|
Number/Quantity |
ü |
Shape/Space |
|
Function |
|
|
|
|
|
|
|
|
|
|
|
Chance/Data |
|
Arrangement |
|
|
Math Actions (possible weights: 0 through 4)
|
|
4 |
Modeling/Formulating |
1 |
Manipulating/Transforming |
|
|
|
|
|
|
|
|
2 |
Inferring/Drawing Conclusions |
3 |
Communicating |
Math Big Ideas
|
|
|
Scale |
|
Reference Frame |
ü |
Representation |
|
|
|
|
|
|
|
|
|
|
|
Continuity |
|
Boundedness |
ü |
Invariance/Symmetry |
|
|
|
|
|
|
|
|
|
|
|
Equivalence |
ü |
General/Particular |
|
Contradiction |
|
|
|
|
|
|
|
|
|
|
|
Use of Limits |
|
Approximation |
|
Other |
|
|
|
|
|
|
|
|
Discussion:
Any reasonable measure of disc-ness should take into account both the radius of the disc and its thickness or height. Let the radius of the disc be R and the height h.
One possible definition of disc-ness might be
![]() .
.
The trouble with this definition is that two geometrically similar objects of different size would have different measures of disc-ness.
This could be fixed by dividing this measure by
![]()
yielding
![]() or
or ![]() .
.
This measure of disc-ness has the property that a very large flat circular sheet has a measure of disc-ness that approaches 1, and a very long thin cylinder has a measure of disc-ness that approaches 1.
Using this measure of disc-ness, there would seem to be a particularly interesting disc whose measure of disc-ness is zero, i.e. the disc whose height is equal to its radius.
Another approach to the problem of disc-ness is to define the
measure of disc-ness to be
![]()
which has the property that the disc-ness of a large thin circular plate grows without limit, while that of a long thin cylinder approaches zero. In contrast to the previous measure, this measure of disc-ness always produces a positive number. (Using this measure, reasonable disc-ness values might be 0.9 for the tuna fish can, 6.3 for the coin, 0.3 for the soup can, 0.08 for the mailing tube, 0.01 for the straw, and 0.003 for the spaghetti.)
Yet another measure of disc-ness might be defined using the ratio of the area of the circular faces to that of the cylinder wall, i.e.
![]() ,
,
which, somewhat to our surprise leads to the measure we had earlier, i.e.
![]() .
.
Still other possibilities exist and should be explored with an eye toward understanding under what circumstances they may prove useful.
|
The Rubric |
partial level (1 or 2) |
full level (3) |
|
Modeling/ (weight: 4) |
Give a measure that is size-dependent or attends to only one attribute. |
Give a measure that is size-independent and reflects the effect of both radius and height. |
|
Transforming/ (weight: 1) |
Make accurate measurements of the given objects. |
Also, properly compute numerical disc-ness values. |
|
Inferring/ (weight: 2) |
In 5, give some discussion of the adaptability to other situations and/or reasonableness of the measure used. |
In 5, give a discussion of adaptability/reasonableness that includes an examination of the extreme cases. |
|
Communicating (weight: 3) |
Adequately convey definitions and measures of disc-ness. |
Give clear and complete descriptions of definitions and measures used. |
The Student Work:
Student A
Student B
Student C
Student D
|
Task name |
Content domain(s) |
Process Weights |
|||
|
|
|
Modeling/ Formulating |
Transforming/ Manipulating |
Inferring/ Drawing Concl. |
Communicating
|
|
shape and space |
4 |
1 |
2 |
3 |
|
|
Student scores |
M/F |
T/M |
I/DC |
C |
||||
|
|
raw score |
icon |
raw score |
icon |
raw score |
icon |
raw score |
icon |
|
Student A |
1 |
|
0 |
|
1 |
|
1 |
|
|
Student B |
1 |
|
3 |
|
1 |
|
1 |
|
|
Student C |
3 |
|
2 |
|
2 |
|
2 |
|
|
Student D |
3 |
|
3 |
|
2 |
|
2 |
|
Performance Icon Codes:
|
|
Shows little understanding of the task |
|
|
Partially meets the aims of the task |
|
|
Engages well with the task |
|
|
Meets all the demands of the task |
Here are observations on each piece of student work; these are the aspects of performance that led us to assign the raw scores shown above.
Student A: Although this student seems to have some intuitive idea of comparing the diameter and height of each object, this is not expressed in any algorithmic way. The scale of 1:10 approach appears to be entirely arbitrary, with no supporting calculations. Descriptions of attributes of flatness and roundness are vague.
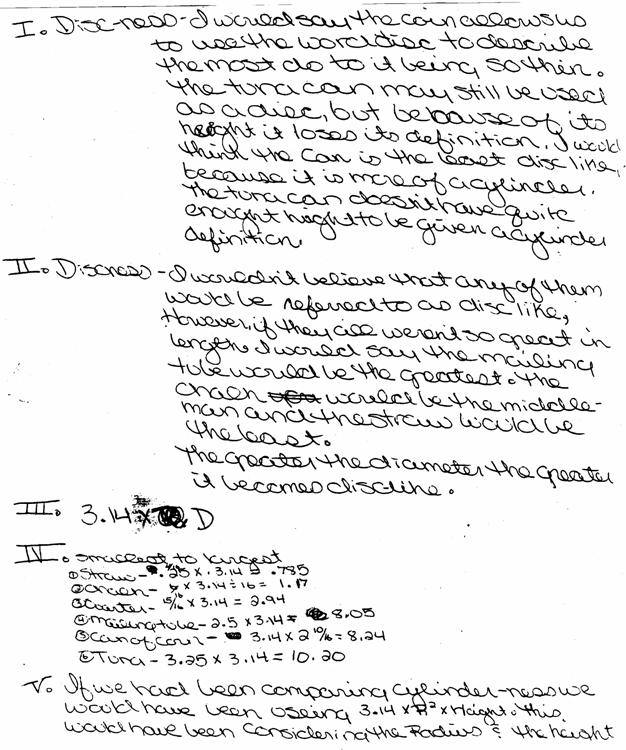
Student B: This student provides a measure of disc-ness that is concerned only with the diameter of the object, and does not see the contradiction between the results of the calculation based solely on this attribute, and the narrative answers given to questions 1 and 2. There is a sense of confusion in this students approach, with the appearance of pulling formulas out of the air (e.g., the volume of a cylinder) with no explanation of their connection to the problem at hand.
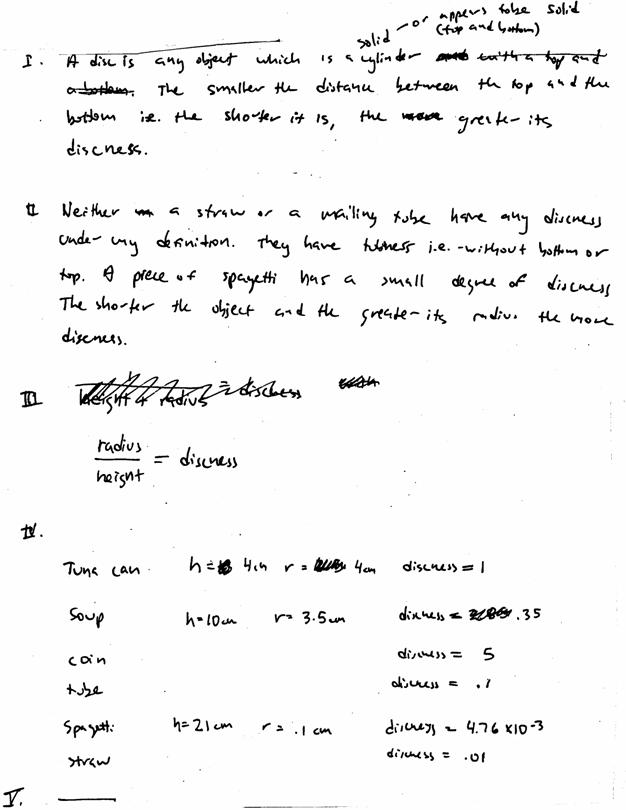
Student C: This student has a working definition of disc-ness that takes into account both the radius and the height. The measures for the given objects are consistent, and part of the definition makes a distinction as to whether or not the object have tops and bottoms (tubeness). There is, however, no answer for question 5, and consequently no justification for the adaptability or reasonableness of the chosen measure.
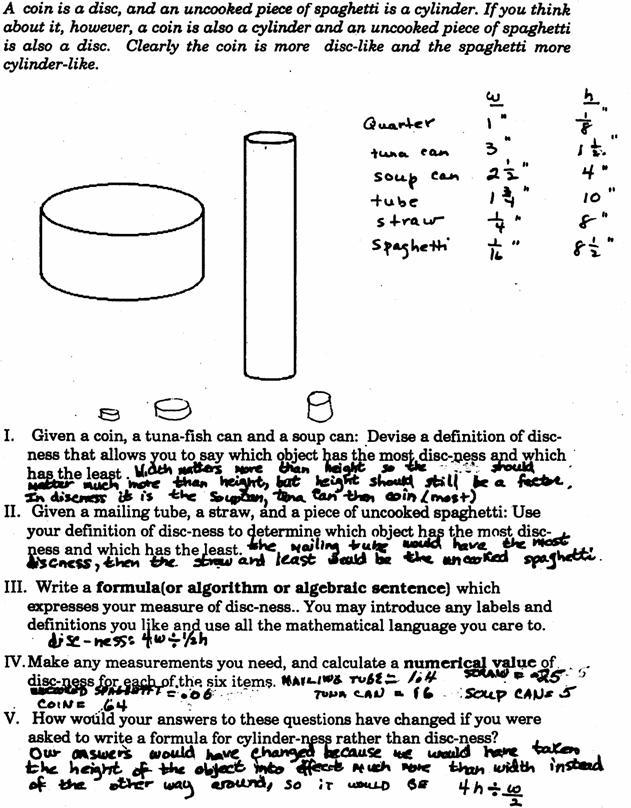
Student D: This student has a clear idea of the relative effect of width and height in this activity. The approach is clear, orderly and sequential, with actual measurements carefully listed. Numerical values are properly computed from the measurements. The response would be improved by a fuller exploration of the adaptability and reasonableness of the provided measure.
Since the weighting and aggregation methods of the MCAPS scoring system are somewhat complicated, it is impractical to compute aggregated scores by hand for many students on many tasks. The MCAPS Scoring Tool automates these computations and produces various reports of student performance.
The MCAPS Scoring Tool is a spreadsheet workbook that requires Microsoft Excel version 4.0, 5.0, 7.0, 95, 97, 98, 2000, or later version, or any other spreadsheet program capable of opening multi-sheet workbooks in Excel format. Versions are available for both Windows and Macintosh computers. Installation procedures vary depending on the computer and distribution method, so installation instructions are provided on a separate sheet that accompanies the floppy disk or CD‑ROM. The following documentation assumes that you have already installed and opened the spreadsheet.
Since the MCAPS Scoring Tool is a spreadsheet workbook, some prior familiarity with the basic functions of your spreadsheet software is necessary. If you have never used a spreadsheet before, consider reading the introductory chapters of your spreadsheet manual before proceeding.
When you first open the MCAPS spreadsheet, the first thing you will see is an Info sheet that contains brief instructions and usage tips. Near the top of this sheet, you will see a row labeled Font installation check, where you should see several shaded squares. If the squares do not appear, the font that the spreadsheet uses to display icons has not been correctly installed, so you should refer back to your installation instructions. If you do not correct this problem, your score reports will contain letters (WW, WG, GB, BB) instead of scoring icons (WW, WG, GB, BB).
Information must be entered into the spreadsheet in two phases, called Task Entry and Score Entry. In the Task Entry phase, you must enter some information about each assessment task on which students will be evaluated. In the Score Entry phase, student names and scores are entered. The current version of the MCAPS Scoring Tool has capacity limitations of 30 tasks and 40 students. However, teachers with more than 40 students can easily work with a separate copy of the spreadsheet for each of their classes.
It is possible to freely jump back and forth between these two types of entry. Additional tasks, additional students, and additional scores can be added at any time.
To begin Task Entry, click on the Task Entry tab at the bottom of the spreadsheet window. Beginning in row 8 of the Task Entry sheet, type into each row a task number and/or name, content domain(s), and process weights. (For all Balanced Assessment tasks published by the Harvard Group, this information is provided in the scoring rubric and/or in a detailed Table of Contents.) You can move between cells either by using the Tab key or by clicking on cells with your mouse.
Here is what the Task Entry sheet should look like after entering data for several tasks:
|
Task number and/or name |
|
Content domain(s) |
|
Process weights |
||||
|
|
|
first
|
second (if any) |
M/F |
T/M |
I/DC |
C |
|
|
|
|
sufficient to type just initial letters (e.g., "N" for Number and Quantity) |
||||||
|
L to Scale |
|
S |
|
|
0 |
2 |
1 |
1 |
|
Egyptian Statue |
|
S |
|
|
1 |
3 |
2 |
2 |
|
Bathtub Graph |
|
F |
|
|
4 |
2 |
0 |
3 |
|
Gligs and Crocs |
|
F |
|
|
3 |
2 |
2 |
2 |
|
Fermi I |
|
N |
|
|
4 |
1 |
3 |
2 |
|
Don't Fence Me In |
|
S |
|
|
4 |
1 |
3 |
2 |
|
Books from Andonov |
|
F |
|
|
2 |
2 |
2 |
2 |
|
Melons and Melon Juice |
|
F |
|
|
3 |
2 |
2 |
2 |
|
Survey Says |
|
C |
|
|
2 |
2 |
2 |
3 |
On the Score Entry sheet, you can enter student names and student scores for any tasks that have already been listed on the Task Entry sheet. Switch to the Score Entry sheet by clicking on the Score Entry tab. The first time you go to the Score Entry sheet, you may need to wait a moment before headings appear showing the names of the tasks.
Each row of the Score Entry sheet will contain scores for one student. You might wish to enter all of one students scores before going on to the next student, or you might wish to enter all scores for one task before proceeding to another task; the spreadsheet will accept data entry in any order.
In most cases, student scores for a single assessment task will consist of four process scores, each in the range from 0 to 3. However, occasionally a task will not carry any weight in one of the process areas. In this case, no score is assigned in that process area, so the appropriate column will bear the heading [skip].
Using two students described in the body of this report, here is what the first few steps of score entry would look like:
|
Student name |
|
L to Scale |
|
Egyptian Statue |
|
Bathtub Graph |
|||||||||
|
|
|
[skip] |
T/M |
I/DC |
C |
|
M/F |
T/M |
I/DC |
C |
|
M/F |
T/M |
[skip] |
C |
|
Student A |
|
|
3 |
2 |
1 |
|
2 |
2 |
2 |
2 |
|
3 |
2 |
|
3 |
|
Student B |
|
|
|
|
|
|
2 |
2 |
2 |
2 |
|
|
|
|
|
Note that the task L to Scale does not have any weight in the Modeling/Formulating process area, so no score is entered in that column. Likewise, Bathtub Graph does not require a score in Inferring/Drawing Conclusions. Also note that no scores were entered for Student B on L to Scale and Bathtub Graph. The spreadsheet does not require that all students complete the same set of tasks. Students are evaluated only on those tasks for which their scores have been entered. In other words, blank entries are ignored in all averages. However, if a student has done a task with no success, their score entry would be a row of 0s, not blanks, and these zeros would be incorporated into the average.
Here are the rest of the score entries for the two students:
|
Student name |
|
Gligs and Crocs |
|
Fermi I |
|
Don't Fence Me In |
|||||||||
|
|
|
M/F |
T/M |
I/DC |
C |
|
M/F |
T/M |
I/DC |
C |
|
M/F |
T/M |
I/DC |
C |
|
Student A |
|
2 |
3 |
3 |
2 |
|
3 |
0 |
3 |
2 |
|
|
|
|
|
|
Student B |
|
|
|
|
|
|
|
|
|
|
|
2 |
2 |
2 |
2 |
|
Student name |
|
Books from Andonov |
|
Melons and Melon Juice |
|
Survey Says |
|||||||||
|
|
|
M/F |
T/M |
I/DC |
C |
|
M/F |
T/M |
I/DC |
C |
|
M/F |
T/M |
I/DC |
C |
|
Student A |
|
|
|
|
|
|
|
|
|
|
|
|
|
|
|
|
Student B |
|
2 |
2 |
2 |
2 |
|
2 |
2 |
2 |
2 |
|
2 |
2 |
2 |
2 |
The MCAPS Scoring Tool produces four types of reports. A Student Report presents an aggregated report of one students performance, as well as a task-by-task record. (In most versions of the spreadsheet, there is an automated method for producing a class set of these student reports.) A Class Report displays a grid of performance icons for each student. A Class Summary condenses the data to just four performance icons per student, one icon for each process area. (As explained in the body of this report, this is the furthest level of aggregation that we find sensible.) Lastly, a Report by Task displays the most detailed information, showing every students performance on every task. You can also make your own report formats by copying and pasting into a word processor.
Here is an example of a report on a single student:
|
Student Report: Student A |
||||
|
Summary of performance |
|
|
|
|
|
|
Modeling/ Formulating |
Transforming/ Manipulating |
Inferring/ Drawing Conclusions |
Communicating |
|
Number and Quantity |
BB |
WW |
BB |
GB |
|
Shape and Space |
GB |
GB |
GB |
GB |
|
Pattern and Function |
BB |
GB |
BB |
BB |
|
Chance and Data |
|
|
|
|
|
Arrangement |
|
|
|
|
|
|
|
|
|
|
|
All content domains combined |
BB |
GB |
BB |
GB |
Performance on each task |
|
|
|
|
|
|
Modeling/ Formulating |
Transforming/ Manipulating |
Inferring/ Drawing Conclusions |
Communicating |
|
L to Scale |
|
BB |
GB |
WG |
|
Egyptian Statue |
GB |
GB |
GB |
GB |
|
Bathtub Graph |
BB |
GB |
|
BB |
|
Gligs and Crocs |
GB |
BB |
BB |
GB |
|
Fermi I |
BB |
WW |
BB |
GB |
In the preceding example, notice that certain cells in the performance grid are empty because the student did not complete any tasks in two of the content areas (Chance and Data, Arrangement).
To display a single student report, begin by clicking on the Choose Stu. tab, and follow the on-screen directions to select a student. Next, click on the Stu. Rpt. tab to view the report on screen. Depending on the speed of your computer, it may take a moment before the report is displayed. (If so, you will see a Calculating Cells message at the bottom of the spreadsheet window.) Once the report is displayed, it can be printed using the File/Print menu command. This report will ordinarily fit on a single printed page. If not, you can adjust the page margins under File/Page Setup and the printer settings under File/Print/Properties.
If you want to print only the students Summary of Performance, just select the relevant cells (use your mouse to drag a shaded rectangle from cell A1 to the lower-right cell that you want to print) then use the File/Print command to print your selection.
If you are using any version of the spreadsheet except for the Excel 4.0 version, there is an automated procedure, a macro called PrintAllStudents, that prints a complete set of student reports. If your spreadsheet toolbar displays a PrintAllStudents button, simply click this button. Otherwise, you will need to use the Macro command on the Tools menu; for more detailed instructions, see the Info sheet (the first screen displayed when you open the spreadsheet file).
Here is a class report for the two students whose scores were shown earlier:
|
Class Report |
|
|
|
|
|
|
|
|
|
|
|
All students combined |
Modeling/ Formulating |
Transforming/ Manipulating |
Inferring/ Drawing Conclusions |
Communicating |
|
Number and Quantity |
BB |
WW |
BB |
GB |
|
Shape and Space |
GB |
GB |
GB |
GB |
|
Pattern and Function |
GB |
GB |
GB |
GB |
|
Chance and Data |
GB |
GB |
GB |
GB |
|
Arrangement |
|
|
|
|
|
Student A |
Modeling/ Formulating |
Transforming/ Manipulating |
Inferring/ Drawing Conclusions |
Communicating |
|
Number and Quantity |
BB |
WW |
BB |
GB |
|
Shape and Space |
GB |
GB |
GB |
GB |
|
Pattern and Function |
BB |
GB |
BB |
BB |
|
Chance and Data |
|
|
|
|
|
Arrangement |
|
|
|
|
|
Student B |
Modeling/ Formulating |
Transforming/ Manipulating |
Inferring/ Drawing Conclusions |
Communicating |
|
Number and Quantity |
|
|
|
|
|
Shape and Space |
GB |
GB |
GB |
GB |
|
Pattern and Function |
GB |
GB |
GB |
GB |
|
Chance and Data |
GB |
GB |
GB |
GB |
|
Arrangement |
|
|
|
|
To display a class report, just click on the Class Rpt. tab. Depending on the speed of your computer, it may take a moment before the report is displayed. Once displayed, the best way to print this report is to select the relevant cells (use your mouse to drag a shaded rectangle from cell A1 to the lower-right cell that you wish to print) then use the File/Print command to print just the selection. If you need to adjust where page breaks occur, either see your spreadsheet manual for instructions, or just highlight one page at a time and print each page separately.
Here is a class summary for the same two students:
|
Class Summary |
|||||
|
|
|
|
|
|
|
|
|
|
Modeling/ Formulating |
Transforming/ Manipulating |
Inferring/ Drawing Conclusions |
Communicating |
|
|
|
|
|
|
|
|
All students combined |
GB |
GB |
GB |
GB |
|
|
|
|
|
|
|
|
|
Student A |
|
BB |
GB |
BB |
GB |
|
Student B |
|
GB |
GB |
GB |
GB |
To display a class summary, just click on the Class Summ. tab. Again, depending on the speed of your computer, it may take a moment before the report is displayed. (If so, you will see a Calculating Cells message at the bottom of the spreadsheet window.) Once the report is displayed, it can be printed using the File/Print menu command. This report will ordinarily fit on a single printed page. If not, you can adjust the page margins under File/Page Setup and the printer settings under File/Print/Properties.
You can view a report showing every students performance on every task by clicking on the Rpt. by Task tab. The information presented here is essentially the contents of your Score Entry sheet, presented in graphical form. If your students have completed a large number of tasks, this report will be too wide to fit on a printed page. If you use the File/Print command to print a copy of the report, you may receive multiple printed pages that can be attached horizontally. Alternatively, some printers will allow you to shrink the report onto a single page; see the printer settings under File/Print/Properties.
Any portion of the MCAPS spreadsheet can be copied into a word processor using the Edit/Copy and Edit/Paste commands. This feature is very useful if, for example, you want to copy a students performance summary into a report document that you are writing on the word processor.
Differences between versions of the MCAPS Scoring Tool
The MCAPS Scoring Tool is available in several versions to support the capabilities and limitations of different versions of Excel, for both Windows and Macintosh. These versions appear and function almost identically. The only significant differences are the following:
· The steps required to run the PrintAllStudents macro vary slightly in different versions of Excel, and the macro is not available at all in Excel 4.0.
· Users of Excel 97 or newer have a pull-down selection box on the Choose Stu. sheet.
· The usage summary and tips on the Info sheet vary to reflect the above differences.
If you need to switch between multiple versions of Excel, it is usually necessary to choose the lower versions MCAPS spreadsheet. For example, someone who uses Excel 5 at school and Excel 97 at home should choose the Excel 5 version of the MCAPS spreadsheet.
Miscellaneous tips
This program does not automatically overwrite existing information; therefore, it is necessary to do a File/Save at the end of each data entry session. It is also good practice to periodically save during periods of extensive data entry.
To move between sheets (Score Entry, Task Entry, etc.) you must click on one of the eight sheet tabs appearing at the bottom of the spreadsheet window. Sometimes, due to a lack of space, some of these tabs may not be visible. If you can only see some of the tabs, scroll through the tabs using the arrows to the left of the tab row. If you cant see any of the tabs, use the menu command Window/Arrange/Tile.
Because the MCAPS Scoring Tool has to make many internal calculations, sometimes it takes a few moments for the screen to be updated, especially on slower computers. If you see a Calculating Cells message at the bottom of the spreadsheet window, the spreadsheet is being updated, but you can usually keep typing. However, if you see the message Calculate, this may mean that your spreadsheet software has been set to recalculate only when commanded. If you see a Calculate message for more than a few seconds, press the F9 key to initiate the recalculation.
If you want to print a copy of the data you entered on the Task Entry sheet and/or the Score Entry sheet, just select any rectangle of cells by dragging the mouse, then use File/Print to print your selection.
Using copy and paste commands to avoid retyping
If you are maintaining more than one spreadsheet for multiple classes of students, you may wish to reenter the same Task Entry information. This can be done by selecting a rectangle of cells (typically starting from Task Entry cell A8) by dragging the mouse, using the Edit/Copy command, then selecting a same‑size rectangle of cells in another MCAPS spreadsheet, and using the Edit/Paste command.
If you already have a list of your students entered in some other spreadsheet or word processing document, you can probably use copy and paste commands to copy the names onto the MCAPS Score Entry sheet. Before using the Edit/Paste command, drag the mouse to select a vertical strip of cells on the Score Entry sheet from cell A8 to the last cell needed.
Last Update: 03/01/2015
Copyright © 2026, The Concord Consortium. All rights reserved.